


5 business strategy frameworks for business growth

How to grow your business with 1 strategy framework
Business Strategy Framework #1 ANSOFF MATRIX ANALYSIS
The Ansoff Matrix is a business strategy framework and a planning tool that provides managers with a template to devise strategies for future growth.
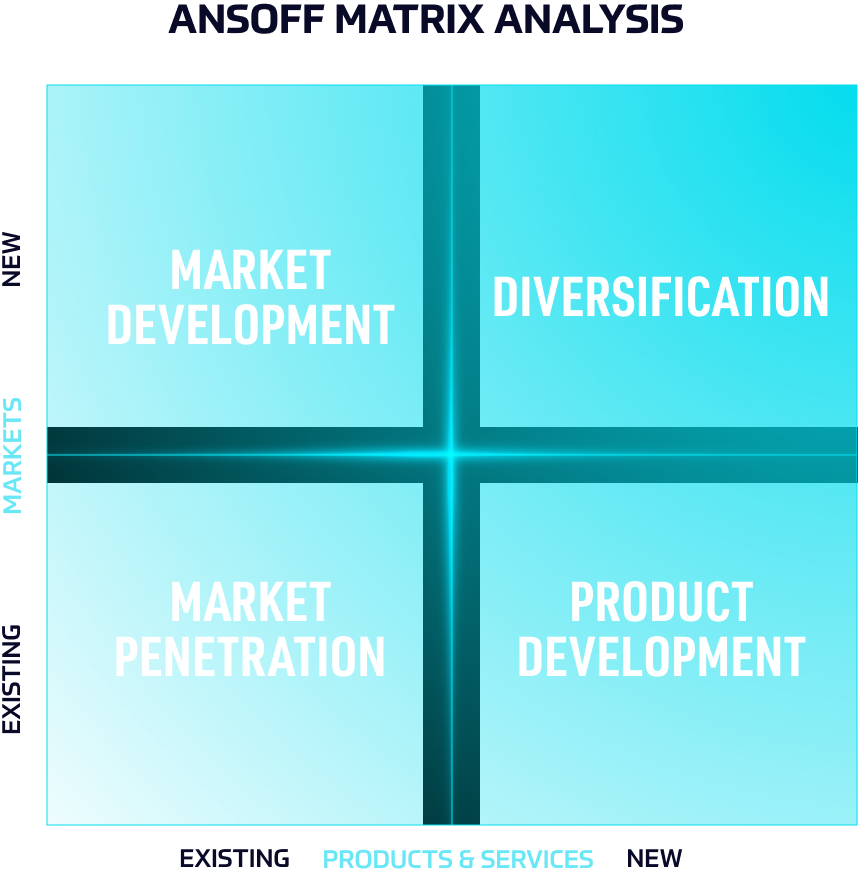
There are 4 growth strategies within the Ansoff Matrix:
- Market penetration strategy = in which the company seeks to improve business performance either; by increasing the volume of sales to its present customers or by finding new customers for present products;
- Market development strategy = in which the company sells its existing products to new markets;
- Product development strategy = in which the company develops new products for the same market;
- Diversification strategy = in which the company develops new products in a new market.
What growth strategies does Apple use?
Learn from our Ansoff Matris analysis of Apple.
Business Strategy Framework #2 BCG GROWTH-SHARE MATRIX
The BCG Growth-Share Matrix helps companies analyze their business units (i.e. their product lines) or any other cash-generating entities by their degree of profitability.
This business strategy framework provides the company with a four-quadrant chart where products are ranked on the basis of their relative market shares and growth rates:
“cash cows”,
“dogs”,
“question marks” and
“stars”.
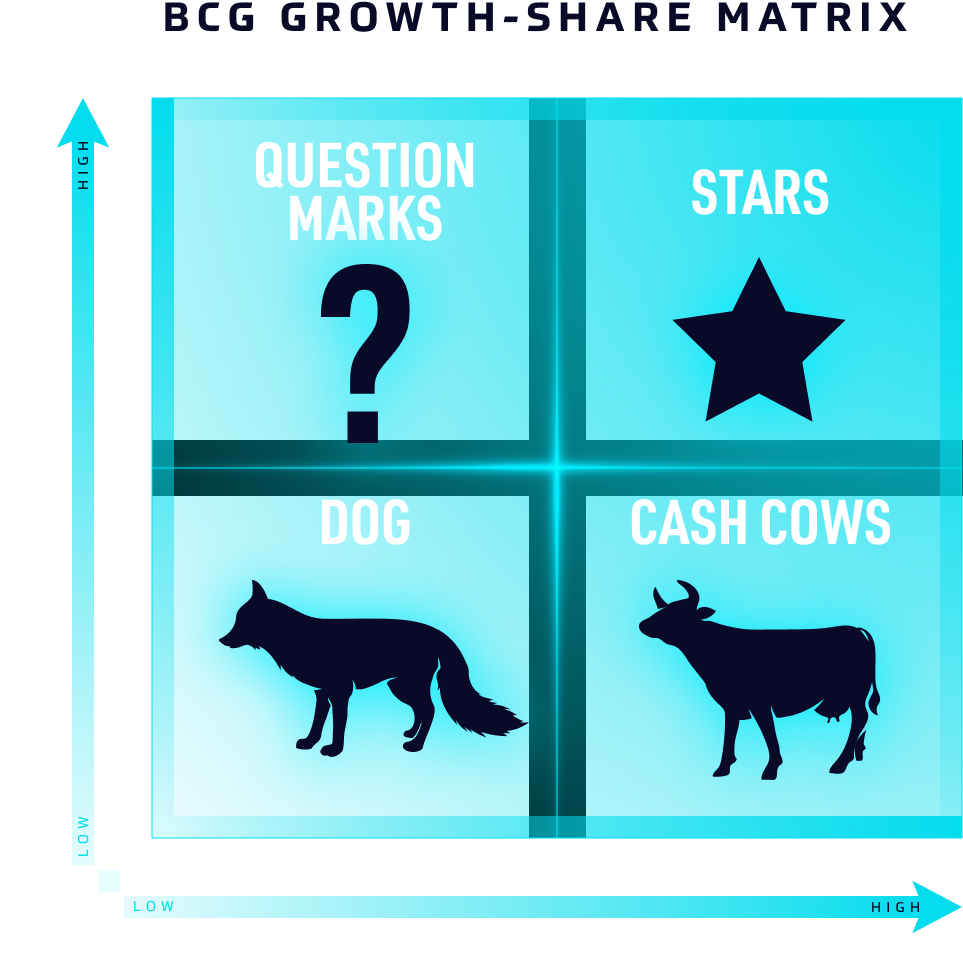
Cash cows are products in low-growth areas for which the company has a high market share.
Products with a low market share in areas with slow growth are dogs.
Question marks are the products with a low market share in a high growth rate market.
Stars are products with a high market share in a high growth rate market.
To show how you can use the matrix for your business, read our analysis of e-commerce leader Amazon, specifically four of its products: Amazon AWS, Amazon Video, Amazon Live and Amazon Echo with Alexa.
Business Strategy Framework #3 PORTER DIAMOND MODEL
The Porter Diamond Model is a business framework that describes a nation’s competitive advantage in the international market.
It also refers to innovation and why certain companies based in certain nations are capable of consistent innovation.
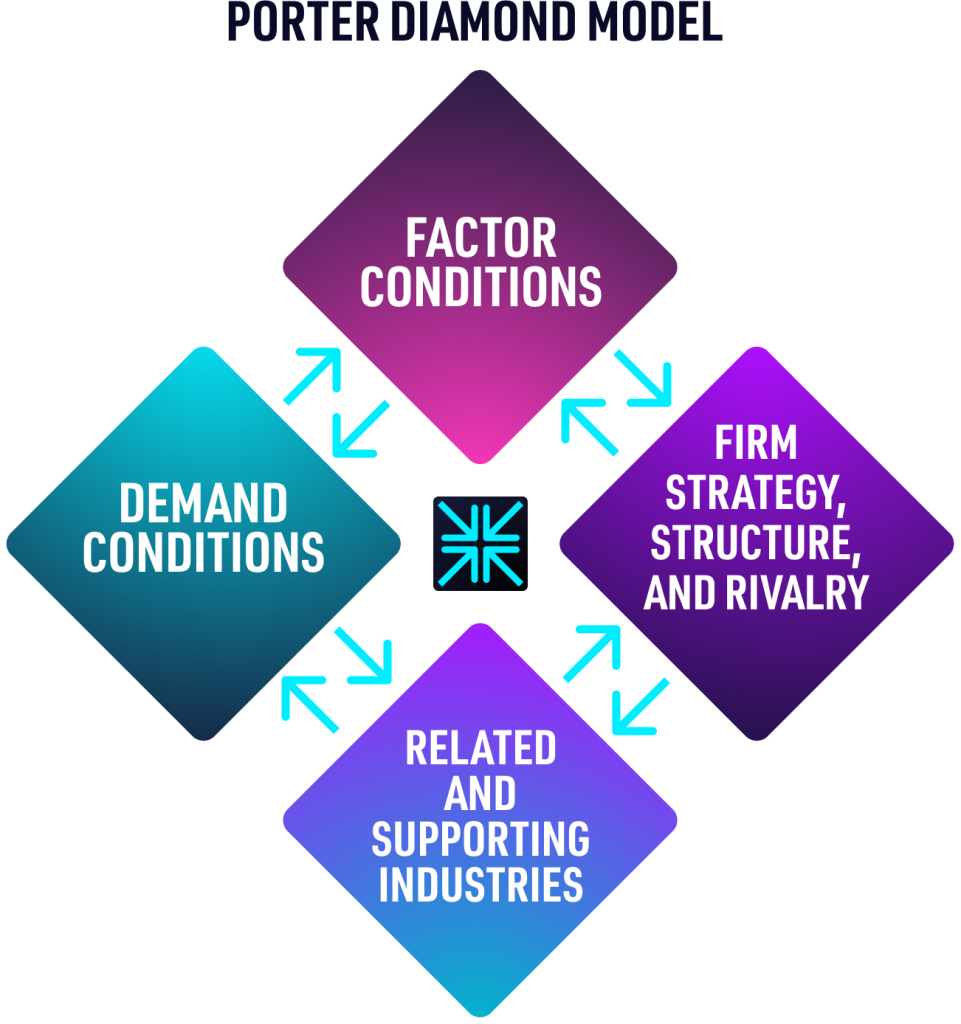
The 4 attributes of the Porter’s Diamond Model:
Factor Conditions = defines the nation’s position in factors of production, such as labour, land, natural resources, capital or infrastructure, necessary to compete in a given industry.
Demand Conditions = refers to the nature of home-market demand for the industry’s product or service.
Related and Supporting Industries = reveals the presence or absence in the nation of supplier industries and other related industries that are internationally competitive.
Firm Strategy, Structure, and Rivalry = highlights the conditions in the nation governing how companies are created, organized, and managed, as well as the nature of domestic rivalry.
Curious to see Porter’s Diamond Model applied to two leading brands?
Read Porter’s Diamond Model Analysis – Louis Vuitton and BMW.
Business Strategy Framework #4 PESTEL
PESTEL business analysis is a framework for helping entrepreneurs and business people to understand the impact of macro-environmental factors on their businesses.
The PESTEL acronym stands for 6 factors: POLITICAL, ECONOMIC, SOCIAL, TECHNOLOGICAL, ENVIRONMENTAL, and LEGAL.
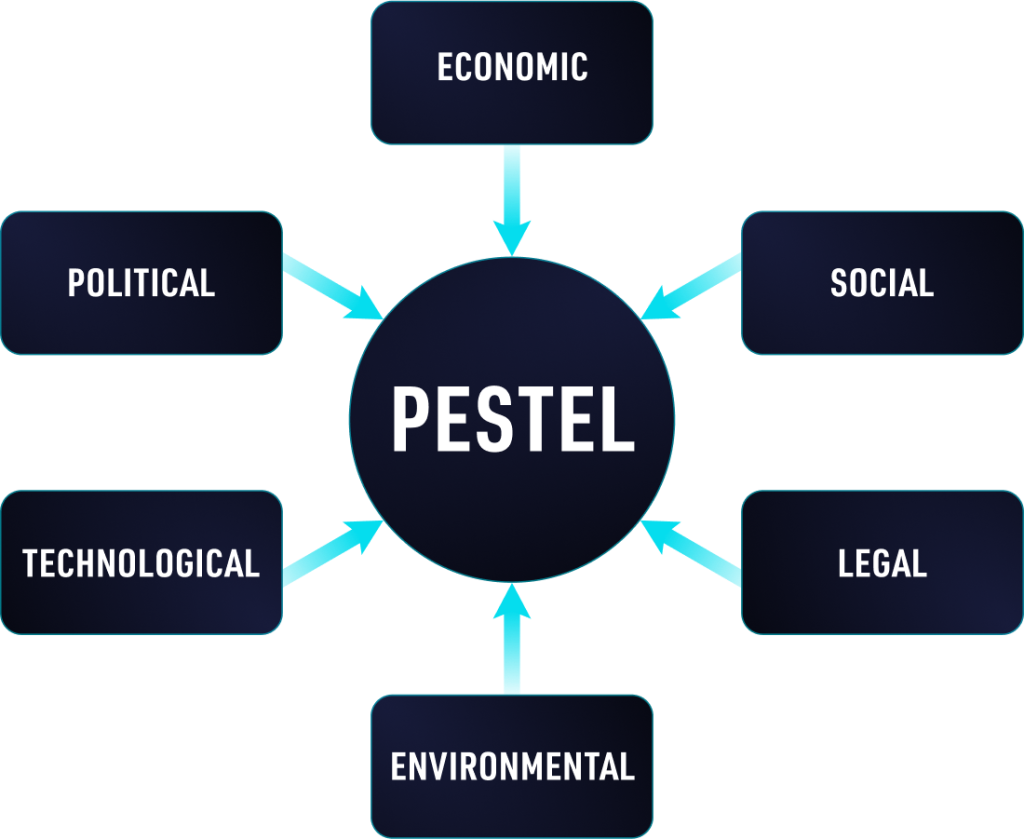
Political factor = helps you appraise the degree to which a government intervenes in the economy or a certain industry.
Economic factor = examines the economic growth, exchange rates, interest rates, unemployment rates, the state of the country’s infrastructure, and taxes.
Social factor = analyzes the profile and behaviour patterns of your customers.
Technological factor = lists the technologies impacting your industry and whether they are or not favourable.
Environmental factor = takes into account any negative impact your company operations have on the environment and prompts your company to reduce the carbon footprint, reduce waste and pollution, and preserve the environment.
Legal factor = looks into the laws and regulations of your industry.
Not sure how to apply the framework to your business?
Read A Pestel Analysis of Nike.
Business Strategy Framework #5 PORTER’S 5 FORCES
Porter’s 5 Forces framework is a valuable business tool that helps entrepreneurs shape their strategy to drive profitability.
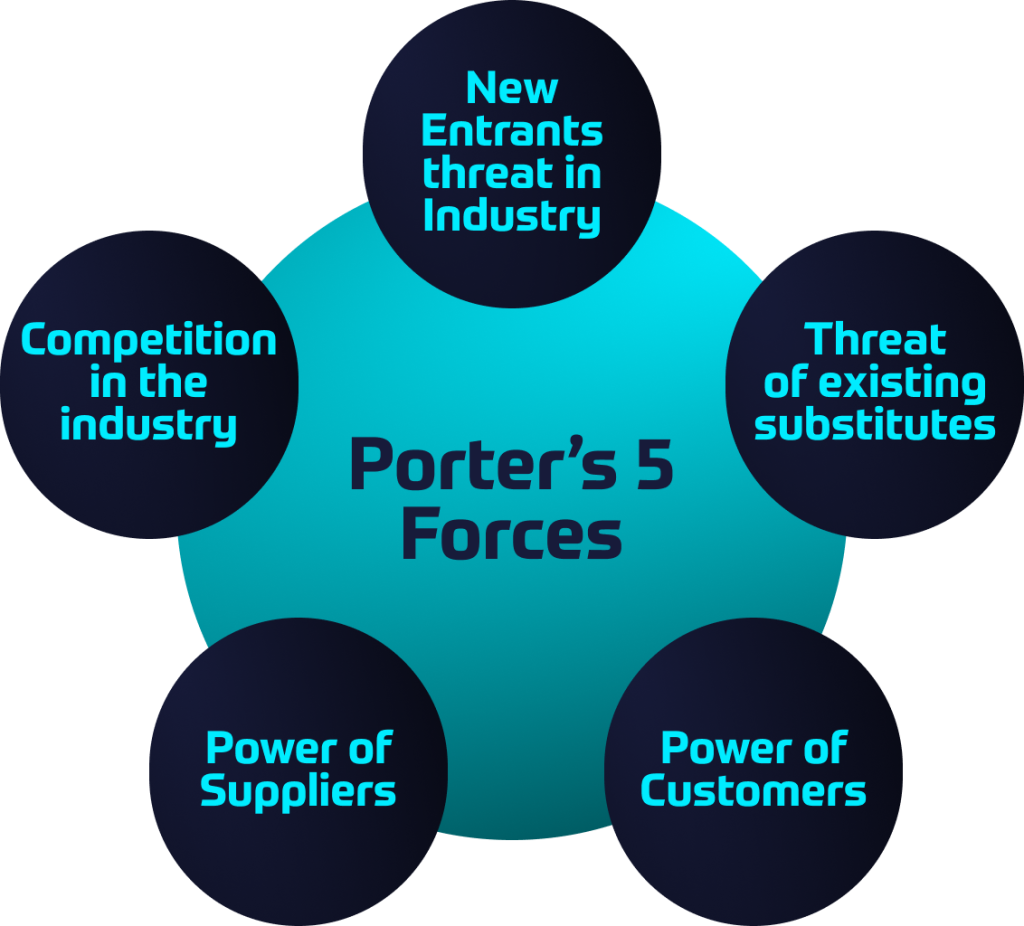
Porter’s 5 forces are:
1. Existing rivals = Evaluate the existing rivals by looking at the number of competitors, their size and power, the industry growth rate and product differentiation.
2. Buyers = The buyers are powerful and can influence the industry if they make purchases in large volumes. Are they price-sensitive? Do they have many alternatives to buy from?
3. Suppliers = Factors in determining supplier power: number of suppliers and concentration, switching costs, availability of substitutes, uniqueness of product, whether or not the industry is an important customer of the supplier and its availability to cut out the middleman.
4. Substitutes = Substitutes are alternative products that fulfil the same need by different means. In the airline industry, the substitutes are trains and cars.
5. New rivals = Is it easy for new rivals to enter the industry? If the entry barrier is low, which means requirements to enter the industry are affordable or readily accessible, then there are increasing chances of new entrants in great numbers. In this case, the threat is high.
Join BRAND MINDS 2023 and learn strategic business moves to uncover new markets from Bestselling Author of Blue Ocean Strategy Renée Mauborgne.

BCG growth-share matrix for Amazon
BCG growth-share matrix is a business framework that helps companies analyze their business units (i.e. their product lines) or any other cash-generating entities by their degree of profitability.
To show how you can use the matrix for your business, let’s analyze e-commerce leader Amazon, specifically four of its products: Amazon AWS, Amazon Video, Amazon Live and Amazon Echo with Alexa.
Before placing each of these products in one of the four quadrants of the BCG growth-share matrix (i.e. cash cows, question marks, dogs and stars), we need to gather the latest information on market size, product market share and market growth rate.
AMAZON AWS
Amazon Web Services (AWS) is the company’s cloud platform, offering over 200 fully-featured services from data centres globally.
AWS offers reliable, scalable, and inexpensive cloud computing services.
AWS Market – Cloud computing services
The global cloud computing market size was valued at $405 billion in 2021 and is expected to expand at a Compound Annual Growth Rate (CAGR) of 20% from 2022 to 2029 (source).
The market is comprised of three services: IaaS (Infrastructure as a Service), PaaS (Platform as a Service), and SaaS (Software as a Service).
AWS is developed with a combination of infrastructure as a service (IaaS), platform as a service (PaaS) and packaged software as a service (SaaS) offerings.
In 2021, AWS brought $62 billion in revenue, up nearly 37% year-over-year (source). 13% of Amazon’s sales and a whopping 74% of its operating income were generated by AWS sales.
AWS Market share – 33%
AWS has 33% of the market, followed by Azure at 20%, Google at 7% with Alibaba Cloud close behind.
AWS market growth rate – 30%
According to the latest reports, the global cloud computing market is expected to grow by 20% annually.
Conclusion
With a 32% market share, growing nearly 30% year on year, Amazon AWS is a STAR.
AMAZON VIDEO
Amazon Prime Video is a video streaming service available for Amazon Prime members.
Amazon Video Market – The video streaming service market (SVOD)
According to Statista, revenue in the video streaming market (SVoD) is projected to reach $71 billion in 2021.
User penetration will be 14.3% in 2021 and is expected to hit 18.2% by 2025.
In 2021, there are 1 billion users of video streaming subscriptions.
Amazon Video Market share – 22%
As of January 2020, there are 150+ million Amazon Prime Video users. The service is available in over 200 countries internationally.
In 2018, Amazon’s Prime Video Channels Biz generated $1.7 billion, which was expected to reach $3.6 billion by 2020 (source).
According to Forbes, in 2020, due to people spending more time at home, Prime Video service emerged as another big player in the streaming wars climbing rapidly in the top 3 global video streaming service providers to a 22% market share. The company had announced plans to spend $7 billion on content last year.
Netflix, the leader of the market, jumped to over 200 million streaming subscribers in 2020 and unsurprisingly, announced a $16 billion budget for new content. Total Netflix 2020 revenue came to $25 billion, up from $20 billion in 2019.
Amazon Video market growth rate – 23%
Revenue for the global video streaming services market is expected to show an annual growth rate for the period 2021-2025 of 11%, resulting in a projected market volume of $108billion by 2025.
The latest reports submit that in 2020, Prime Video subscriptions accounted for 23% of SVOD subscriptions, a sharp increase from its previous 14% last quarter (source).
Conclusion
Amazon Video has been growing steadily over the past few years and in 2020 the number of subscribers received a boost. Currently the 2nd most popular video streaming service provider, Amazon Video has still a long way to go and a lot of money to invest. According to the BCG growth-share matrix, Amazon Video is a star.
AMAZON LIVE
Amazon Live is a live streaming service that allows sellers to “promote discovery” of their products by hosting their own livestreams for customers on Amazon.
According to data from Sensor Tower, Amazon Live was released in February 2019.
Amazon Live is the company’s second attempt at live-streaming. Back in March 2016, Amazon launched its first foray into live stream shopping, Style Code Live. Style Code Live was focused on fashion-related Amazon products.
Amazon Live – live commerce market
Live commerce is growing rapidly. It’s estimated to already be $60 billion annually. Last year over 430 million people, about 30% of China’s population, viewed livestreams, and in 2020, it’s projected to reach 560 million, or around 39%. Sales from live streams are expected to grow more than 100% in 2020 vs. 2019 (source).
Live-streaming is rapidly transforming into a standard feature for e-commerce. Taobao’s live commerce surged in 2019, achieving a growth rate for live-streaming-prompted-sales of over 150% for three consecutive years, making it the fastest growth model of e-commerce globally. In China, the latest reports show that the live commerce market has reached $66 billion in 2019 and is expected to double in 2020.
During last year’s Singles Day, Taobao saw an increase of more than 220% in the number of merchants participating in live streaming over the past 12 months. Gross merchandise value (GMV) sold during the 2020 Singles Day reached $74billion (source).
Amazon Live market share – N/A
Amazon Live is just starting out so I couldn’t find statistics related to its market share.
Amazon Live market growth rate – N/A
Sales from live streams are expected to grow globally more than 100% in 2020 vs. 2019 (source). Although live shopping has been reported to increase sales, Amazon hasn’t released any statistics on how many sellers use its Live platform yet. To be on the safe side, let’s assume the live platform to have a low market growth.
Conclusion
Live e-commerce is growing exponentially. Remember the internet boom in the early 1990s? This is the stage we are at with shopstreaming and China is the spearhead. With a low market share and low market growth, in a hyper-growth market, Amazon Live is a question mark type of product. With the right resources and strategy, Amazon Live could transform into a star. But if the market conditions are not assessed correctly, it could downgrade into a dog type of product.
AMAZON ECHO + ALEXA
The Amazon Echo with Alexa, the virtual assistant is a smart speaker.
In January 2019, Amazon’s devices team announced that they had sold over 100 million Alexa-enabled devices.
Amazon generated about $1.4 million in Alexa “skill” revenue in 2019 — about 25% of the forecasted $5.5 million. Despite its success with homeowners, Amazon Echo with Alexa is yet to prove a financial success.
Amazon Echo + Alexa – Smart speakers market
Amid the COVID-19 crisis, the global market for Smart Speaker was estimated at $2.7 billion in the year 2020. The market is projected to reach a revised size of $19 billion by 2027, growing at a CAGR of 32% over the analysis period 2020-2027 (source).
Amazon Echo + Alexa market share – 21,6%
Amazon was the leading vendor in the global smart speaker market, having a market share of %21.6% in the second quarter of 2020.
Google is Amazon’s closest competitor, with a share of 17.1% in the same quarter. Chinese vendors Baidu, Alibaba and Xiaomi have become strong players in recent quarters, thanks to growing demand in the Chinese domestic market (source).
Amazon Echo + Alexa market growth rate – 32%
The smart speaker market is growing at a CAGR of 32%.
Conclusion
In 2017, Amazon Alexa had a market share of almost 80%. Google began developing and investing in its own smart speaker and gnawing at Amazon’s lead. Currently with a shrinking 21,6% market share, negative market growth and underperforming revenue, in a growing market, Amazon Alexa is a dog type of product.
Join the Conversation
We’d love to hear what you have to say.
Get in touch with us on our LinkedIn Page, Facebook Page, Twitter or TikTok.
What is the BCG Growth-Share matrix and why you should use it in your business?
The BCG Growth-Share matrix is the sixth business framework showcased in our BUSINESS reSOURCES series. Check the previous five: Porter’s 5 Forces, PESTEL, Hofstede’s Cultural Dimensions theory, the Porter Diamond Model and the McKinsey 7S model.
What is the BCG growth-share matrix and why should you use it in your business?
The growth-share matrix is a business framework that helps companies analyze their business units (i.e. their product lines) or any other cash-generating entities by their degree of profitability.
The matrix was created in 1970 by management expert Bruce Henderson, founder of Boston Consulting Group (BCG), one of the most influential strategies consulting organizations in the world.
Also known as the BCG growth-share matrix, this business analytical tool provides the company with a four-quadrant chart where products are ranked on the basis of their relative market shares and growth rates.
The company then decides where to allocate resources and which products to prioritize.
What are the 4 quadrants of the BCG matrix?
Let’s dive deeper and learn more about the four quadrants of the matrix.
The 4 quadrants of the BCG growth-share matrix are “cash cows”, “dogs”, “question marks” and “stars”.
BCG growth-share matrix – Cash cows
Cash cows are products in low-growth areas for which the company has a high market share.
These products generate large amounts of cash that are higher than the market’s growth rate. Also, the revenues generated by these products exceed the amounts reinvested to maintain share. These products are the company’s most profitable and they should be milked for cash for as long as possible.
BCG growth-share matrix – Dogs
Products with a low market share in areas with slow growth are dogs.
They may show an accounting profit, but the profit must be reinvested to maintain share which in the end, leaves the company with empty pockets or even negative cash returns. Companies should investigate further to determine if these products are profitable in the long run or they should be liquidated.
BCG growth-share matrix – Question marks
The Question marks in the company’s portfolio are the products with a low market share in a high growth rate market.
These products typically grow fast and have the potential to become stars. But before they reach this stage, question marks almost always require far more cash than they can generate. Companies should investigate these products and the market circumstances to determine if they are worth maintaining in their portfolio.
BCG growth-share matrix – Stars
Stars are products with a high market share in a high growth rate market.
They generate cash and use cash at the same time. Companies should invest in stars to support their further growth as they are expected to become cash cows. Depending on the characteristics of the market these products live in, they could become cash cows or they could turn for the worst and become dogs.
Every company needs products in which to invest cash. Every company needs products that generate cash. And every product should eventually be a cash generator; otherwise, it is worthless.
Only a diversified company with a balanced portfolio can use its strengths to truly capitalize on its growth opportunities.Bruce Henderson, creator of the BCG growth-share matrix, an excerpt from The Product Portfolio
Here is a short explanation of the BCG growth-share matrix:
How do you use the BCG growth-share matrix?
If you are a business owner or developer, use the BCG growth-share matrix to determine the nature of your company’s portfolio.
Do you have a cash cow? How many questions marks does your company invest resources in? Are there any dogs in your portfolio? How about stars?
It’s necessary to acquire a clear picture of your products in order to make the right decisions.
You need to first choose the product to which you will apply the matrix, define the market of your product, calculate the market share and find out the growth of the market.
After you have gathered all the needed information, you can determine which quadrant of the BCG growth-share matrix your product belongs to.
If your product is a cash cow, milk it for everything it’s got. Don’t reinvest the revenue back into the cash cow! Use it to grow a question mark into a star or a star into a cash cow.
If your product is a dog, perform a deeper analysis to determine whether or not it should be liquidated. Please note dogs are not to be invested in!
Is your product a question mark? If it is, do you have the necessary resources to help it become a star? And is the effort worthwhile for your business?
Is your product a star? Then invest your resources to help the product become a cash cow.
Join the Conversation
We’d love to hear what you have to say.
Get in touch with us on our LinkedIn Page, Facebook Page, Twitter or TikTok.