


Is car sharing the next version of Uber?
The carsharing or car-sharing system is a model of car rental where people rent cars for short periods of time, often by the hour. They are attractive to customers who make only occasional use of a vehicle, as well as others who would like occasional access to a vehicle of a different type than they use day-to-day.
According to Wikipedia, carsharing services are available in over 1,000 cities in several countries. As of December 2012, there were an estimated 1.7 million car-sharing members in 27 countries, including so-called peer-to-peer services, according to the Transportation Sustainability Research Center at U.C. Berkeley. Of these, 800,000 were car-sharing members in the United States.
As of July 2017, car2go is the largest carsharing company in the world with 2,500,000 registered members and a fleet of nearly 14,000 vehicles in 26 locations in North America, Europe and Asia, followed by Zipcar with 767,000 members and 11,000 vehicles. According to Navigant Consulting, global carsharing services revenue will grow to US 6.2 billion by 2020, with over 12 million members worldwide. The main factors driving the growth of carsharing are the rising levels of congestion faced by city dwellers; shifting generational mindsets about car ownership; the increasing costs of personal vehicle ownership; and a convergence of business models. Carsharing contributes to sustainable transport because it is a less car intensive means of urban transport, and according to The Economist, carsharing can reduce car ownership at an estimated rate of one rental car replacing 15 owned vehicles. More about the concept here.
In February, the car-sharing service Zipcar signed a deal to provide vehicles to Uber, possibly portending additional future cooperation in the field of mobility services. Zipcar parent Avis Budget Group said that it would supply Uber drivers with the opportunity to ferry passengers around in Zipcar branded sedans. Although at the beginning the deal is limited to 20 sedans in Boston, it opens the door for similar collaboration in other cities.
Zipcar provides rent-by-the-hour vehicles to motorists, particularly in urban areas, as an alternative to car ownership. Now, Uber drivers will be allowed to access the fleet of vehicles in Boston to serve their customers at hourly rental rates.
“As the automotive landscape evolves, technology is playing an ever-increasing role in transportation services, and we are well-positioned to meet new and evolving customer needs and demands, as evidenced by this new partnership,” said Andrew Kupiec, a vice president for Avis Budget. “Our quality, well-maintained vehicles, coupled with Zipcar’s technology, will give Uber’s driver partners wheels when they want them.”
This move marked one of the latest in a series of Uber partnerships with car providers, including rental car firms Enterprise and Hertz, and most recently a deal with German automaker Daimler to provide self-driving cars in the future.
Moreover, last year, Uber started a partnership with GM’s Maven, representing a 90 day pilot in San Francisco that allowed the Uber drivers to lease a Chevrolet Cruze, Malibu or Trax for $179 per week (plus fees) with no mileage limit, and included insurance. “This partnership with Maven combines our vast ridesharing network with GM’s extensive fleet vehicles and gives people without access to a car the ability to easily make money driving on the Uber platform,” said back then Rachel Holt, regional general manager Uber, for engaged.com.
Following that, in April, Uber made another important step, by launching Uber Central, similar to the consumer version of Uber, except multiple cars can be ordered at once. The service could be especially valuable for businesses that need to pick up several clients from different places at the same time. Uber Central is part of the Uber for Business platform, which Uber launched a few years ago to help businesses manage employees’ ground transportation needs.
What is even more interesting and different is that passengers don’t need an Uber account or even a smartphone. The business itself manages the rides and all related information from a single dashboard. According to ciodive.com, Uber said more than 8,000 companies participated in the pilot program. The new tool also includes reporting, billing and management features.
Uber’s interest in the sharing cars’ programs and affiliations doesn’t stop here. Only four days ago it was announced that, following the 2016’s 90 days trial with GM’s Maven, the service is available now also in Boston, Phoenix, and Washington, DC, while Baltimore and Detroit are said to be following soon.
“The program is aimed at drivers for rideshare apps like Uber and Lyft, and delivery apps like Postmates, GrubHub, and InstaCart. Someone who’s interested in driving for any of these on-demand services, but doesn’t own a vehicle, can rent a Chevy Bolt through Maven Gig for $229-a-week. The weekly price includes insurance, maintenance, and electric vehicle charging. Maven first launched its gig worker product last May in San Diego and San Francisco. Since then, Maven says its customers have logged 170 million miles driving for various on-demand apps,” wrote The Verge.
More on the subject you can read here, while if you are interested in 8 ride and car sharing alternatives to Uber and Lyft, you can read here.
5 Free Instagram Analytics Tools for Marketers
Finding the right strategy that will for sure help your brand is not an easy task. The right Instagram tools can provide analytics to inform your social media strategy and content scheduling. If you are looking for some free tools to help your business on Instagram, we have 5 ideas that would come in handy.
Instagram Insights
If you’ve set up your Instagram business account, you have access to free analytics through the Instagram app. Instagram Insights provides basic stats for assessing your Instagram marketing efforts. Find out more about your followers, when they’re on Instagram, and what your top posts are. This information will help you choose content more likely to resonate with your audience.
To access these insights, tap the bar chart icon in the top-right corner of the app. The first analytics screen shows high-level insights for the last week and comparison stats for the week before. You can view your total impressions, reach, profile views, and website clicks. It also shows your top posts and stats for your Instagram stories from the last 24 hours. Swipe to the right to see your reach. Swipe right one more time to see website clicks data.
source: TechCrunch
You can also view your top posts insights, just by tapping the see more link next to top posts and the top six posts from the past seven days sorted by impressions. The tool also allows you to see followers insights. Back on the main Insights page for your account, scroll down to the Followers chart of times when your followers are on Instagram. Also, if you’re running paid Instagram ads, the Promotions section of the main Insights screen gives you relevant stats on your campaigns.
Socialbakers
With Socialbakers, you can get a free report on your most popular Instagram photos, filters, and hashtags, and all of your interactions with followers. The most useful sections are the most liked and most commented posts because this information can help inform the types of images you use in future Instagram posts.
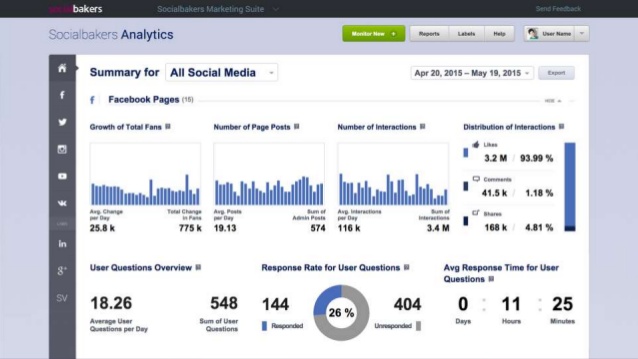
To get your free report, go to Socialbakers’ Free Instagram Analytics Tool and click Login With Instagram.
Simply Measured
Simply Measured offers a free Instagram report for users with up to 25,000 followers. The stats and insights are presented clearly and will help inform your Instagram posting strategy. The report lets you quickly see what has worked well in your Instagram marketing, so you can apply these insights to future posts. To get started, type your Instagram account name in the text box and click Authenticate With Any Instagram Account. Then log in and authorize Simply Measured to access information from your Instagram account. When you receive your report, you’ll find three tabs of information: Charts, Scorecard, and Appendix. The buttons in the top-right corner of the screen let you download the report to Excel or export it to PowerPoint.
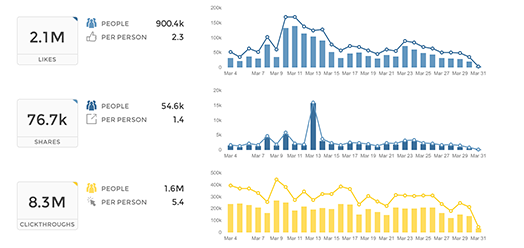
On the Charts tab, you can view a wealth of insights about your most engaging posts and average engagement per post. Moreover, the Engagement chart shows Instagram engagement over time. See total engagement, engagement as a percentage of followers, and information on likes and comments your photos and videos received.
You can also examine the Scorecard (it gives you some basic stats about your Instagram account) and Appendix Tabs (check out a table of your top posts sorted by highest engagement with the date of the post, type, likes, comments, and total engagement – likes and comments).
It offers a free Instagram account checkup to assess how you’re doing on the network. While the report isn’t as comprehensive as some others, it offers handy nuggets of data for marketers. It helps you determine the best time to post, which hashtags to use, and what content to post more (or less) of. It also highlights your top followers and reminds you to engage with them. To access your free report, click Start Your Checkup on the home page and then sign up for a Union Metrics account.
You can view the number of posts by day. Use the icons in the top-right corner of the page to share, print, or download your report. Scroll down to examine more stats with recommendations from Union Metrics, such as the best time and day to post. You can also view stats and visuals for your top-performing posts. If you click the circles on the hashtag report, you can see more information about the hashtags, which is a handy feature.
Squarelovin
With Squarelovin, you can get free basic Instagram analytics. The Optimization section offers insights that help inform Instagram posting. The “worst times to post” information is especially valuable. First, you’ll need to sign up for a Squarelovin account. On your dashboard, you can view high-level stats and access additional analytics screens. On the Postings tab, you’ll get information on your post history and top posts. It also shows your posts by year and month and day and time. The Engagement tab shows information on likes and comments, and highlights the top liked and top commented posts. The Optimization tab shows the best time and day to post on Instagram, but also the worst times to post on specific days.
If you use different filters on Instagram, you can also view the impact of those filters. Moreover, the report lets you see all of the Instagram hashtags you’ve used next to a list of the most popular hashtags. You can quickly see if you’re using top hashtags or if you need to rethink your hashtag strategy.
Understanding whom your Instagram fans are and what content they engage with and when will give you ideas for future content to share on the network.