


The Gaming Industry – No Longer A Child’s Play
We are introducing a new series of articles: the Growing Industries series. This series will include articles focused on industries that have experienced continuous growth in previous years to give you valuable insights and inspiration.
Ready Player One is set in 2045 with the world on the brink of chaos and collapse, where people are hooked on playing games. Although the movie’s story takes place 26 years in the future, today’s state of play (pun intended) makes it possible.

The gaming industry – no longer a child’s play
If the numbers show anything is that the gaming industry is no longer a child’s play; in fact, it’s a game for the big boys.
This article presents the numbers that illustrate the state of the industry in 2018.
Global games market
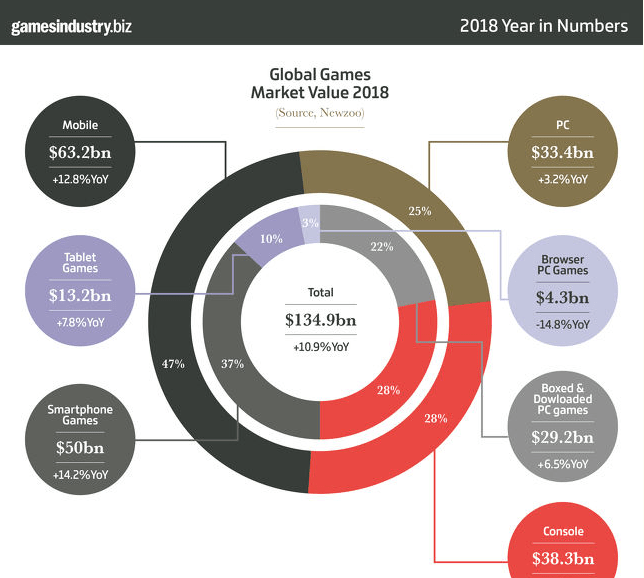
source: gamesindustry.biz
The global games market is valued at $134.9B with a 10%YoY.
- Mobile $63B +12%YoY
- Smartphone games $50B +14%YoY
- Console $38 +15%YoY
- PC $33B +3%YoY
- Boxed & downloaded PC games $29B +6%YoY
- Tablet games $13B +7%YoY
- Browser PC games $4B -14%YoY
Mobile games make out 47% of the total market value with console games at 28% and PC games at 25%.
source: filmora.wondershare.com
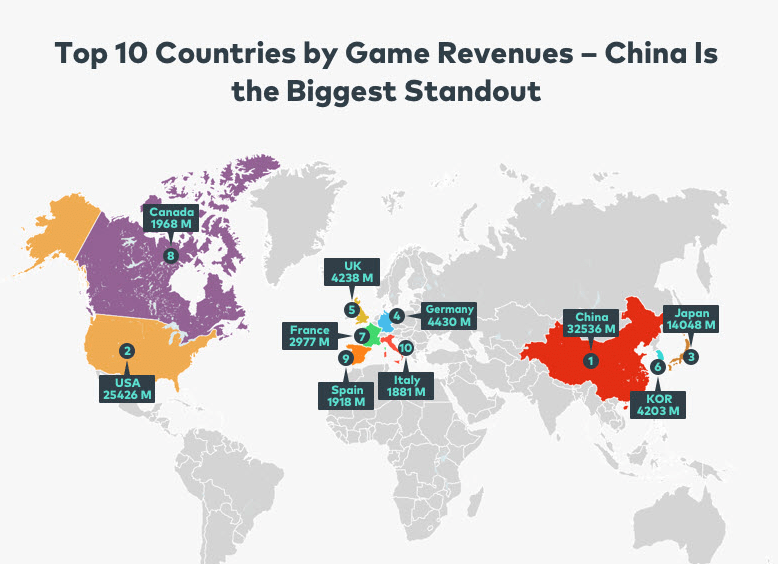
Top 3 countries by revenues
China $32M
USA $25M
Japan $14M
source: filmora.wondershare.com
Top 3 games developer companies by revenues
Tencent $12M
Sony $6M
Activision Blizzard $5M

source: filmora.wondershare.com
No of gamers worldwide
Worldwide there are 2 billion gamers half of whom come from the Asia-Pacific region.
54% are men
46% are women
63% of all gamers in 2018, are from 21 to 50 years of age
Women prefer puzzles and action/adventure games.
Men prefer action/adventure, shooter and strategy games.
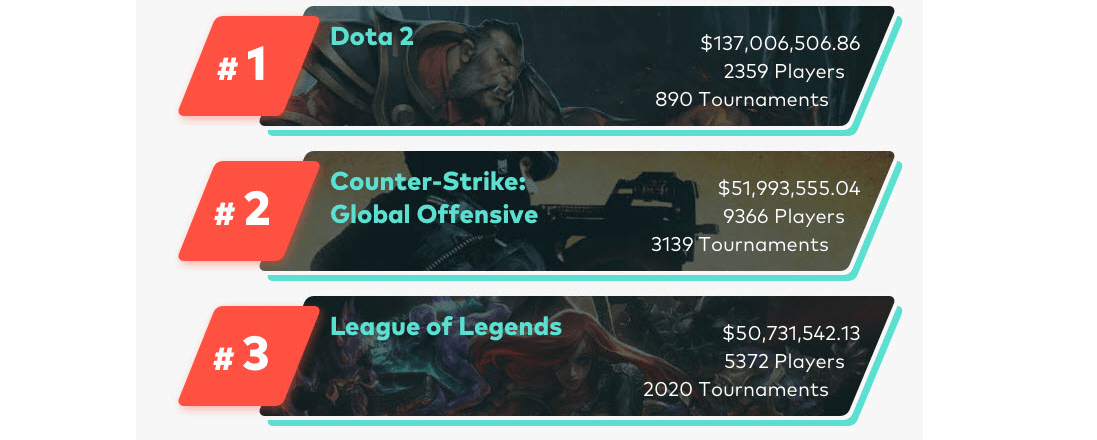
Top 3 games awarding prize money
Dota 2 – $137M, 2359 players and 890 tournaments
Counter-strike – global offensive $52M, 9366 players and 3139 tournaments
League of Legends – $51M, 5372 players and 2020 tournaments
Top 3 earning pro gamers
Kuro Takhasomi $3.56M
Amer Barqawi $3.14M
Saahil Arora $2.95M
Top 3 Best-Selling Games
FIFA 19 (Electronic Arts) – 4,980,635 units
God of War (Sony Interactive Entertainment) – 5,026,257 units
Spider-Man (Sony Interactive Entertainment) – 5,177,202 units
source: gamecrate.com
Expert Statement
Challenge is the gaming industry
Working in gaming industry is every kid’s dream, I do hear this a lot. Nothing further from the truth, or maybe not?
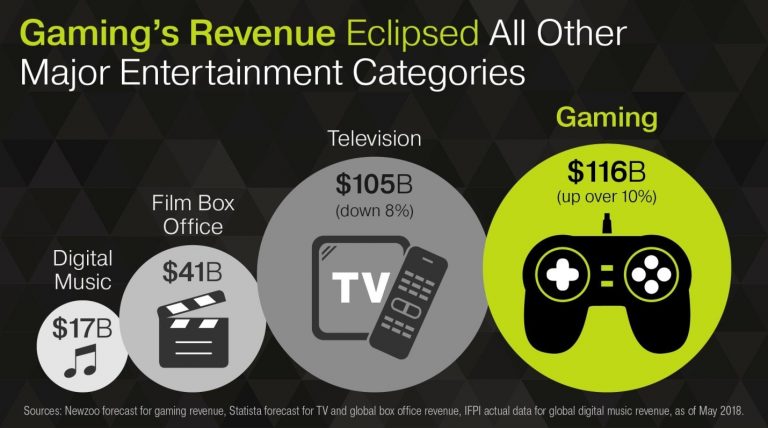
When you are looking at the figures, you realize that gaming is way bigger than the movie industry and the music industry put together. We’re talking about +130Bn $ in 2018 alone.
Mobile gaming has 51% of the pie according to Newzoo and registered +25% increase compared with 2017. So yes, no pressure whatsoever.
When you know that +60% of the smartphone owners are downloading at least one game within a week of the acquisition and when mobile games account for 40% of the time spent on smartphones, only now you begin to realize the challenges the industry is facing.
The competition has grown exponentially and that led to huge volume of free content. The players’ expectations are rising and this brings both development costs and user acquisition costs to the next level. The domino effect continues and if we add in the equation the dynamics of technology development we come up with and overwhelming conclusion:
Once you’re in you need to keep playing !Adrian Stanciu
Head of Sales and Advertising for South Central Europe – Gameloft
Join the Conversation
We’d love to hear what you have to say.
Get in touch with us on Facebook Group and Twitter.
—————————————————————————————————————————————–
sources:
https://www.gamesindustry.biz/articles/2018-12-17-gamesindustry-biz-presents-the-year-in-numbers-2018
https://247wallst.com/special-report/2018/12/04/the-best-selling-video-games-of-2018/6/
https://filmora.wondershare.com/infographic/video-game-trends-and-stats.html
Video Marketing Statistics 2018 – How Brands used Video for Business
Brands use video marketing to help them achieve various marketing and sales goals. Although creating such content may be challenging for marketers, when brands combine creativity and customer insights, it’s a win-win situation.
Here are 8 statistics regarding video consumption and the results reported by brands who used video marketing (source: wyzowl):
- Where both video and text are available on the same page, 72% of people would rather use video to learn about a product or service;
- In a typical day, people watch 1.5 hours of video on average and 15% watch more than 3 hours of video;
- If you create video content that your specific audience enjoys, 83% of consumers would consider sharing it with their friends;
- 85% of people say they expect to see more video from brands in 2018;
- Sales increase – 76%;
- Traffic increase – 76%;
- Increased dwell time on website – 80%;
- 81% of people have been convinced to buy a product or service by watching a brand’s video.
Vidyard, a video platform that helps businesses transform communications and drive more revenue through the strategic use of online video, has released its 2018 Benchmark Report – Video in Business.
Their insights are based on first-party data collected from the Vidyard video platform from more than 600 businesses and over 250.000 videos in a 12 month period.
Here are the findings of Video in Business report:
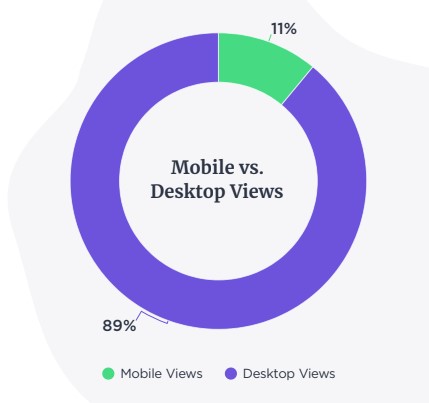
Consumption of business-related video content
Consumption of business-related video content is predominantly taking place on desktop browsers – 89% desktop, 11% mobile.
58% of video views are performed on Chrome.
2018 Video in Business Benchmark Report
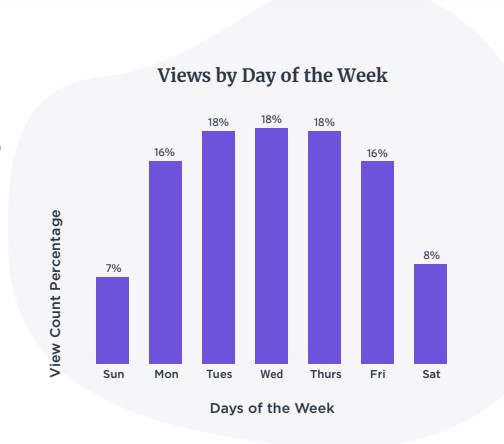
The highest traffic time is middle of the week
The highest traffic is on Tuesdays, Wednesdays and Thursdays with 18%.
The highest viewership on Tuesdays, Wednesdays and Thursdays is between 10 am – 13 pm, while on Mondays and Fridays the viewership shifts to 12 pm – 15 pm.
The lowest viewership for business videos is on Saturdays and Sundays.
2018 Video in Business Benchmark Report
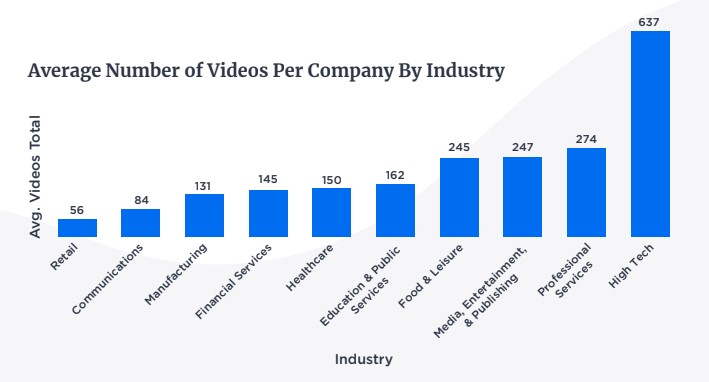
The industry with the highest number of videos published in total
The industry with the highest number of videos published is High Tech with 637 videos, followed by Professional Services with 274 videos and Media, Entertaining & Publishing with 247 videos.
A company in High Tech publishes on a monthly average a number of 53 videos.
The months with the highest number of videos are August, October and November – 11%.
2018 Video in Business Benchmark Report
Video production resources
47% of large companies use a combination of internal and external resources while 54% of small businesses and 50% of medium businesses use internal resources to produce their videos.
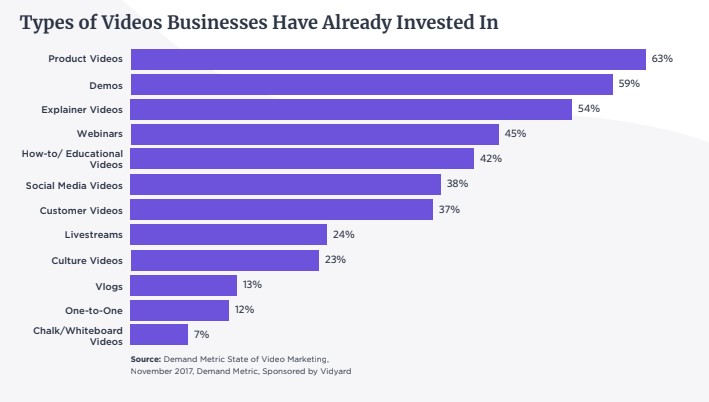
Top 3 Video content by type
63% are product related videos, 59% demos, 54% explainer videos.
2018 Video in Business Benchmark Report
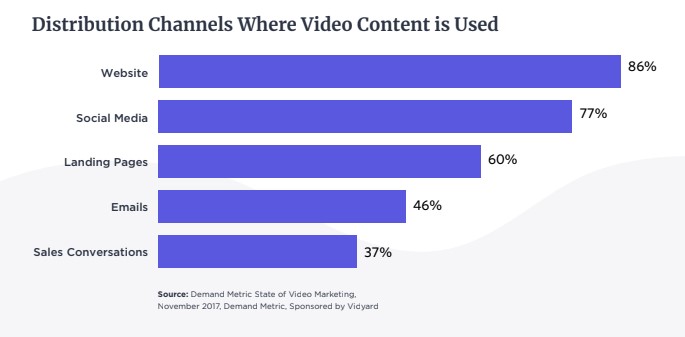
Top 3 video distribution channels
86% of companies host their videos on their website, 77% share them on social media and 60% place them on landing pages.
2018 Video in Business Benchmark Report
Video length
75% of videos are less than 2 minutes, 54% up to 60 sec.
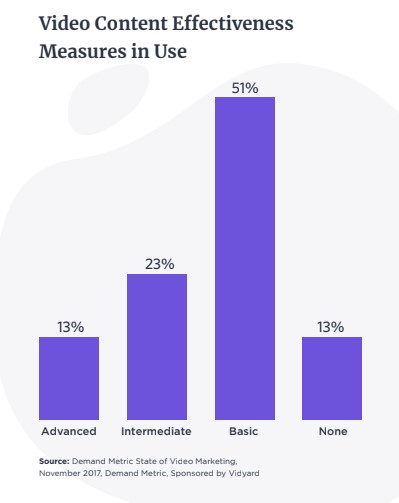
51% of companies use basic video performance analytics, 23% use intermediate, 13% use advanced and the rest of 13% use no analytics at all which means the companies using advanced analytics are twice as likely to report the return on their video investments.
2018 Video in Business Benchmark Report
Conclusions:
- Videos published on average: 377;
- New videos published every month: 33;
- The video libraries of businesses will double within 12 months;
- Most new videos are published by businesses in High Tech and Professional Services;
- Businesses have seen a growing demand for videos throughout their customer life-cycle;
- Companies use videos for their mid and bottom marketing funnels;
- Businesses using videos on landing pages jumped from 49% to 60%, businesses using video in email jumped from 36% to 46%, video in sales conversations increased from 25% to 37%;
- Companies are either producing very short videos (up to 2 minutes) or long-form videos such as webinars;
- The average retention rate by end of a video is 46%;
- 86% of marketers using advanced analytics reported they were satisfied with their video marketing results.